


Your store is busy. Staff are moving. Customers are coming in and out. But you pull up the numbers at the end of the day and something doesn’t add up. Sales are flat. Margins are thin. And you’re not quite sure where the gap is.
That’s the problem with gut feel. It can tell you the store feels right. It can’t tell you why the numbers are wrong.
Metrics don’t lie, but they don’t explain either. A number tells you something slipped. It doesn’t tell you where, or why, or what to do before it slips further. That’s what this guide does. It walks you through the key retail store operations efficiency metrics, what each one actually measures, how to calculate it, and most importantly what operational failure it’s usually pointing to.
What Are Retail Store Operations Efficiency Metrics?
Let’s start with what they are NOT. They’re not just sales reports. They’re not vanity numbers for a quarterly deck that head office reviews and you never see again. And they’re not a verdict on how hard your team is working.
Retail efficiency measurement metrics are operating signals. They tell you, on any given day or week, whether your store is functioning the way it’s supposed to, before a bigger problem shows up. Think of them as early warnings rather than final scores.
From a floor manager’s perspective, these metrics answer one question: is my store running the way it was designed to run? Is the space earning? Is the team converting? Is the stock where it should be? When a metric dips, it’s not just a number getting worse; it’s a signal that something in your day-to-day operation has broken down. The metric shows you the symptom. Your job is to find the cause.
Key Retail Store Operations Efficiency Metrics & KPIs You Need
Each metric in this section connects directly to daily store operations. When these numbers move in the wrong direction, the root cause is rarely about market conditions or customer behaviour; it’s about whether your team executed the fundamentals: displays set on time, stock replenished correctly, planograms followed, and tasks completed as scheduled.
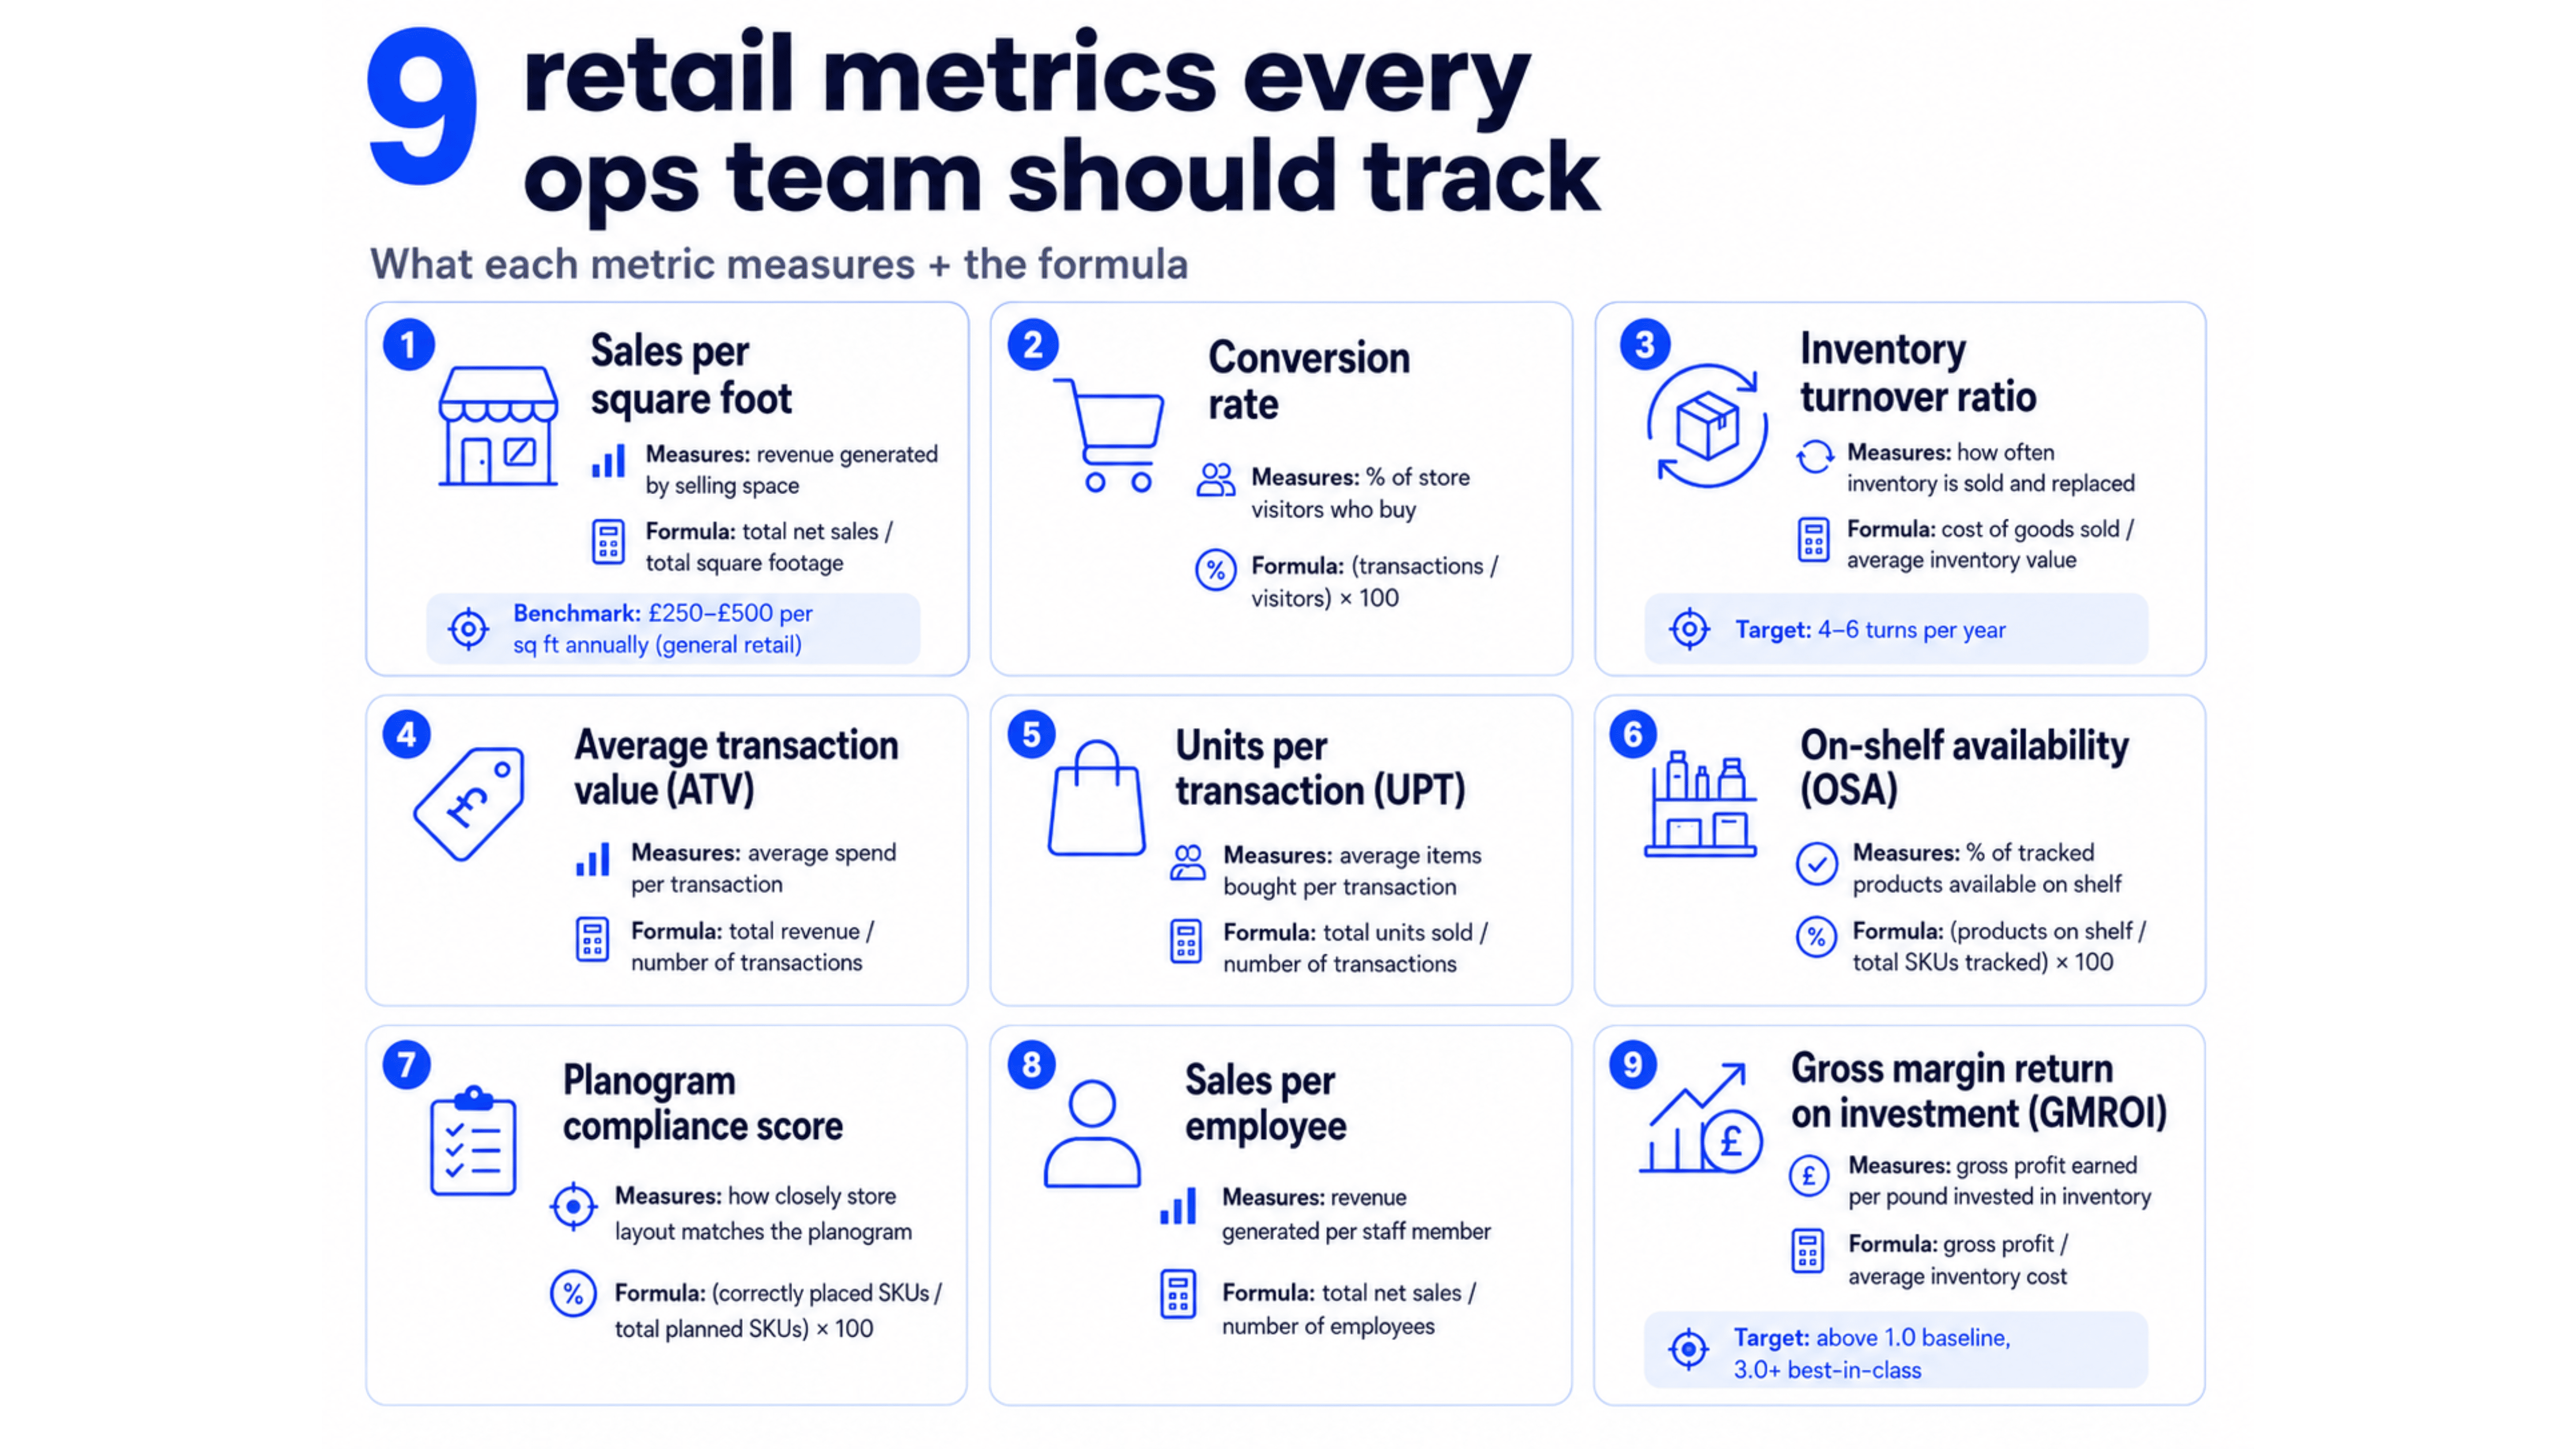
Sales Per Square Foot
What it measures: how much revenue your selling space is generating.
| Formula | Total net sales / Total square footage |
|---|---|
A good benchmark for general retail sits around £250–£500 per square foot annually, though this varies significantly by category. Fashion retail tends to sit at the lower end; FMCG and convenience formats can run much higher.
When this number is low, the instinct is to blame foot traffic or pricing. But the more common cause is execution: Planogram compliance failures, dead zones that nobody’s refreshing, or products placed in the wrong part of the store. Low sales per square foot is often a visual merchandising problem before it’s a sales problem.
Conversion Rate
What it measures: how many of the people who walk into your store actually buy something.
| Formula | (Number of transactions / Number of visitors) × 100 |
|---|---|
A healthy conversion rate varies by format, destination retailers with high intent shoppers will naturally convert better than high-street fashion; but any sustained drop is a flag worth investigating immediately.
What conversion rate really tells you is whether your floor staff are engaging or just present. A team that’s occupied with admin, restocking, or internal tasks isn’t on the floor selling. But conversion also drops when the store isn’t set up properly. If the opening checklist wasn’t completed: the entrance display is bare, the promotional signage isn’t placed, the feature area is half-stocked — customers are walking into a store that isn’t doing its job.
Inventory Turnover Ratio
What it measures: how many times your inventory is sold and replaced within a given period.
| Formula | Cost of goods sold / Average inventory value |
|---|---|
For most general retail, four to six turns per year is a reasonable target. FMCG and grocery operations will turn stock far more frequently. Below four turns are worth investigating.
Low inventory turnover usually means one of two things: you’re holding too much stock, or the right stock isn’t making it to the floor fast enough. Both of these are operations problems. Missed stock-check tasks, poor communication due to lack of a retail employee communication software between the shop floor and back-of-house, and no escalation path for replenishment issues all contribute to a ratio that slowly gets worse without anyone noticing until it shows up in a report.
Average Transaction Value (ATV)
What it measures: the average amount a customer spends per visit. Also known as basket size.
| Formula | Total revenue / Number of transactions |
|---|---|
ATV tells you whether upselling and cross-selling are happening on the floor. When ATV is low, the reflex response is to blame the team’s selling skills. But more often, it traces to execution failures upstream.
Promotional displays that weren’t set up on time, product bundles that weren’t placed correctly, or a merchandising brief that didn’t reach the floor; all of these directly suppress ATV without a single customer complaint. The customer didn’t refuse the upsell. They were never offered it because the display wasn’t there.
Units Per Transaction (UPT)
What it measures: the average number of individual items a customer buys per transaction.
| Formula | Total units sold / Number of transactions |
|---|---|
UPT is worth tracking separately from ATV because ATV can rise even when customers are buying fewer items if prices increase, your average transaction value goes up while UPT stays flat or falls. UPT tells you whether customers are actually picking up more.
To make this concrete: if your UPT is 1.2, most customers are buying one item and walking out. That’s a problem. But it’s not always a selling problem. A UPT of 1.2 often means complementary products aren ’t positioned near each other, add-on displays aren’t set correctly, or there’s no visual cue prompting customers to consider a second item. Fix the display and the floor execution, and UPT tends to move before any additional training is needed.
On-Shelf Availability (OSA)
What it measures: the percentage of products that are available on the shelf at any given time, compared to what should be there.
| Formula | (Products available on shelf / Total SKUs tracked) × 100 |
|---|---|
OSA is one of the most direct revenue metrics in retail. A product that isn’t on the shelf doesn’t sell regardless of how much demand there is for it. Customers who can’t find what they came for either leave empty-handed or, worse, go elsewhere.
Low OSA almost always traces back to task management failures rather than supply chain issues. Nobody was tasked to check the back-of-house replenishment zone at the right time. There was no escalation path when a shelf went empty. The manager had no visibility into which sections had gaps until a customer or auditor flagged it. The stock exists. The process to get it to the shelf broke down.
Planogram Compliance Score
What it measures: how closely your store layout matches the intended planogram — the official plan for where every product should sit.
| Formula | (Correctly placed SKUs / Total planned SKUs) × 100 |
|---|---|
Planogram compliance tells you whether your store looks the way it’s supposed to look. It matters because planograms are built with purpose; they’re designed to maximise sales per square foot, guide the customer journey, and ensure promotional products get the placement they’ve been allocated.
When compliance scores are low, the cause is rarely intentional. Instructions aren’t reaching the floor in a way that’s actionable. Staff complete a reset but have no clear task system to check against. The VM brief arrives by email, gets seen by one person, and doesn’t translate into consistent execution across the team. Compliance doesn’t slip because people stop caring — it slips because the system for delivering and verifying tasks isn’t working.
Sales Per Employee
What it measures: the revenue generated per member of staff, a proxy for how effectively your team is deployed.
| Formula | Total net sales / Number of employees |
|---|---|
Low sales per employee can mean two very different things. Either your scheduling doesn’t match your foot traffic — you’re overstaffed during quiet periods and understaffed during peaks — or your staff time is being absorbed by administrative tasks rather than floor activity. Chasing follow-ups, logging issues manually, or waiting for task instructions to arrive all pull people off the floor without appearing anywhere on a sales report.
Gross Margin Return on Investment (GMROI)
What it measures: how much gross profit you earn for every pound invested in inventory.
| Formula | Gross profit / Average inventory cost |
|---|---|
A GMROI above 1.0 means you’re generating more in gross profit than you spent on inventory — the baseline you’d expect from a functioning retail operation. Best-in-class retail typically sits at 3.0 or above.
This metric leans more finance-side than operations-side, and it’s usually set by purchasing decisions upstream. But store operations affect slow-moving stock, clearance markdowns driven by overbuying, and poor replenishment all erode GMROI over time. It’s worth knowing, even if it’s not a metric you’ll move directly from the shop floor.
KPI Formula in Retail with Example
Last month, your store achieved the following performance metrics:
- Net Sales: £180,000
- Selling Space: 600 square feet
- Customer Visits (Traffic): 4,200
- Completed Transactions: 840
- Total Units Sold: 1,050
Now, let’s apply these figures to key retail KPI formulas to calculate performance metrics:
- Sales per square foot = £180,000 ÷ 600 = £300 per sq ft
- Conversion rate = 840 ÷ 4,200 = 20%
- Average transaction value (ATV) = £180,000 ÷ 840 ≈ £214.29
- Units per transaction (UPT) = 1,050 ÷ 840 = 1.25 units
- Average selling price (ASP) = £180,000 ÷ 1,050 ≈ £171.43
Which KPI Measures Operational Efficiency?
No single KPI measures operational efficiency on its own. The most useful combination is conversion rate, on-shelf availability (OSA), and planogram compliance score — together, they show whether your store is executing the way it was designed to.
Here’s why those three together tell the clearest story. Conversion rate shows whether the customer experience is working but it doesn’t tell you why it might be failing. OSA tells you whether products are where they need to be, which is a prerequisite for any sale. Planogram compliance tells you whether the store is set up the way it was intended, which underpins both of the others. A store with strong compliance and high OSA will almost always convert better than one without. When all three are tracked together, you can pinpoint operational breakdowns before they become significant revenue problems.
Key KPIs for Retail Store Manager
Not all KPIs are yours to move. Some are set by buyers, supply chain decisions, or head office strategy. Trying to manage metrics that sit outside your control is a quick route to frustration.
The metrics that sit squarely within a store manager’s daily influence are: conversion rate, planogram compliance, on-shelf availability, units per transaction, and sales per employee. These are the five numbers your daily decisions directly affect.
Your floor coverage decisions affect conversion. Your task management affects planogram compliance and OSA. How your team is briefed and deployed affects UPT and sales per employee. Every other metric in this guide matters, but these five are the ones where the gap between a good week and a bad week lives in decisions you made or tasks that didn’t get done.
If you’re being pulled in every direction and you need to know where to focus: start with these five. Get them stable, and the broader picture tends to follow.
Why Metrics Slip (And It’s Usually Not the Numbers)
Here’s the thing most retail software doesn’t say out loud: almost every KPI problem is an execution problem, not a strategy problem.
The metric shows you the symptom. It tells you OSA is at 78% when it should be above 90%. It tells you conversion dropped three points this week. It tells you planogram compliance is inconsistent across the store. What it doesn’t tell you is why, and the answer is almost always the same.
None of these are strategy failures. They’re not evidence that the team doesn’t care or that the plan was wrong. They’re task failures — instructions that didn’t reach the right person, problems that had no escalation path, managers with no visibility until the metric showed up in a report.
When tasks are tracked, executed, and escalated properly, metrics stabilise. That’s the operating truth most retail software doesn’t address; it measures the outcome but doesn’t touch the process that creates it.
The Gap Between Knowing and Executing
You can know every metric in this guide. You can benchmark against national averages, build tracking sheets, and review dashboards every morning. But if the tasks that move those metrics aren’t happening on the floor, the numbers won’t change. Knowing is not the same as executing.
The gap between a well-run store and a struggling one is rarely a strategy. It’s the daily tasks that either get done or don ’t. The VM brief that either lands or gets missed. The stockout that either gets escalated or sits for three days. Operations is the work between the plan and the result. That’s where metrics are actually won or lost.
Amply helps retail teams run their stores, not just measure them.
Store task management, operations automation, maintenance ticketing, and visual merchandising all in one place. So your team spends less time chasing follow-ups and more time on the floor.
FAQ
What Are Key Performance Indicators in Retail
The five most tracked retail performance indicators are sales per square foot, conversion rate, inventory turnover ratio, average transaction value (ATV), and gross margin return on investment (GMROI). Each one measures a different dimension of store performance from space efficiency to stock profitability. Together they give a complete picture of how well your store is operating.
What is operational efficiency in retail?
Operational efficiency in retail means getting the most output from your store’s resources: its space, its staff, and its stock — with the least amount of waste. It’s not just about cutting costs. It’s about making sure every square foot earns, every staff hour converts, and every product is where it should be when a customer wants it.
Which KPI measures operational efficiency?
No single KPI measures operational efficiency on its own. The most reliable combination is conversion rate, on-shelf availability (OSA), and planogram compliance score. Together they show whether your store is executing the way it was designed to.
What KPIs measure visual merchandising effectiveness?
Planogram compliance score, sales per square foot, units per transaction (UPT), and conversion rate track visual merchandising performance and display execution quality.


